First glance impression from data on Armenia’s recent Presidential Election: Manipulation?
First glance impression from data on Armenia’s recent Presidential Election: Manipulation?
Date:
February 22, 2013
Introducing our new International Fellow:
By Gabriel Armas-Cardona
Measuring the randomness of numbers is a well-developed field and of vital importance for testing the validity of election data. Multiple tests have been developed to test for randomness among data sets, including the last-digit test. These types of tests, including the last-digit test, can be used to help determine whether election data has been manipulated.
The Last-Digit Test
The last-digit test involves looking at the last, or final, digit of each number and counting how many 0s, 1s, 2s, …, and 9s there are. If the numbers are random, then each digit should appear at the end with an equal percentage, 10%. If certain digits appear much more or much less frequently than 10%, then that difference is evidence that the numbers are not random and that they’ve been manipulated.
Applying the last-digit test to election data is a standard method to determine whether the results have been manipulated. Special mention has to be made to Policy Forum Armenia’s Special Report on the 2012 Parliamentary Election. In that report, Policy Forum Armenia uses the last-digit test, among others, to demonstrate that the official 2012 results have been manipulated.
Applying the Last-Digit Test to the 2013 Presidential Election Results
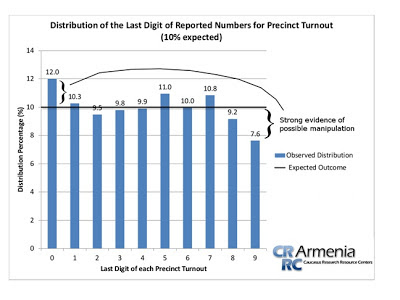
Using the last-digit test for the 2013 election involves examining the turnout results from every precinct in the election. The turnout at each precinct is not a random number; if a precinct has a 1,000 eligible voters, one can expect a turnout between 300-700. What is random is the last digit of the turnout, and Policy Forum’s Report lists the theoretical support for this test (see page 25). Looking at the last digit of the turnout for each precinct that has at least 100 voters should create an even distribution, with each digit appearing 10% of the time (available on http://res.elections.am/images/doc/masnak18.02.13p_en.pdf). At the same time, it has to be mentioned that this is not entirely true for small numbers because of Benford’s Law. To compensate for this deviation, only turnout results of at least three digits, i.e. at least 100 voters, were analyzed.When applying the test to the 2013 precinct data, we don’t get an even distribution (see graph 1).
Graph 1: Distribution of the Last Digit of Reported Numbers for Precinct Turnout
Looking at the graph, anyone can see there are some wide variations from the expected result of 10% for each digit. In particular, we find that ‘0’ is overrepresented by 2%, ‘5’ is overrepresented by 1% and ‘9’ is underrepresented by 2.4%. These differences hint at human manipulation as humans tend to prefer some numbers over others (look at, for example, What the Numbers Say: A Digit-Based Test for Election Fraud, Bernd Beber and Alexandra Scacco (2012). To mathematically test for manipulation of the data, a chi-square analysis of the actual results compared to the expected results of 10% per digit can show whether the deviation is significant.
Conducting a chi-square analysis of the precinct turnout finds that the data is statistically improbable. Conducting a chi-square analysis comparing the actual outcome with the expected outcome of 10% finds that it’s statistically improbable that the data is random (n=1899, Chi-square value=23.4, p=.005; statistically significant). This implies that that the data has been manipulated.
This test was repeated after dividing the data between Yerevan and outside of Yerevan with differing results. When looking at precincts within Yerevan, the chi-square value is low and it’s plausible the distribution results from randomness (n=467, Chi-square value=9.85, p=.363; not statistically significant.). Looking at precincts outside of Yerevan finds again a statistically improbable outcome that implies manipulation (n=1432, Chi-square value=19.7, p=.02; statistically significant).
Conclusion
Conclusion
Using the last-digit test, it’s statistically improbable that the data distribution is random, implying the data has been manipulated. The last-digit of the precinct turnout should have an even distribution, but instead it has the statistically improbable distribution shown in graph 1. This evidence of manipulation disappears when looking only at Yerevan, but it reappears when looking at precincts outside of Yerevan. This analysis does not prove that the official results are fake, but it does show that it’s improbable that the results occurred naturally and it is likely the turnout results are altered to some extent. This first glance impression perhaps will encourage researchers to dig more and come up with more relevant findings.
Category
Blog